Chapter 22: Performance
Measure the frame, then find what allocates
There are two kinds of performance conversation in game development. One begins "the game feels janky" and ends with somebody changing a foreach to a for because they read that it is faster. The other begins with a graph.
This chapter is about the second kind, and it starts with the number most people report and almost nobody should. Average frame time is the least useful figure you can quote. A game that averages 14 milliseconds and spikes to 40 twice a second is a game that feels broken, and its average says it is comfortably inside a 60 fps budget. The player does not experience the average; they experience the spikes.
So the profiler in this chapter reports the worst frame and the 95th percentile alongside the mean, draws the last two seconds as a graph with the budget as a line across it, and counts garbage collections — because on a phone, the single most common cause of a spike is not slow code but code that allocates.
What you will learn in this chapter
- Why average frame time hides exactly the problem you are looking for.
- What the 95th percentile and the worst frame tell you that the mean does not.
- How to write a rolling frame-time window with no allocation, using a ring buffer.
- Why
GC.CollectionCount(0)is the cheapest useful allocation signal on a device. - The frame budget arithmetic — 16.7 ms at 60 fps — and what actually fits inside it.
- The common sources of per-frame allocation in a MonoGame game, and how to remove them.
- Why you must profile a Release build on a device, and what a Debug build on a desktop tells you instead.
- The caveats: measurement overhead, thermal throttling, and optimising the wrong thing.
The code for this chapter
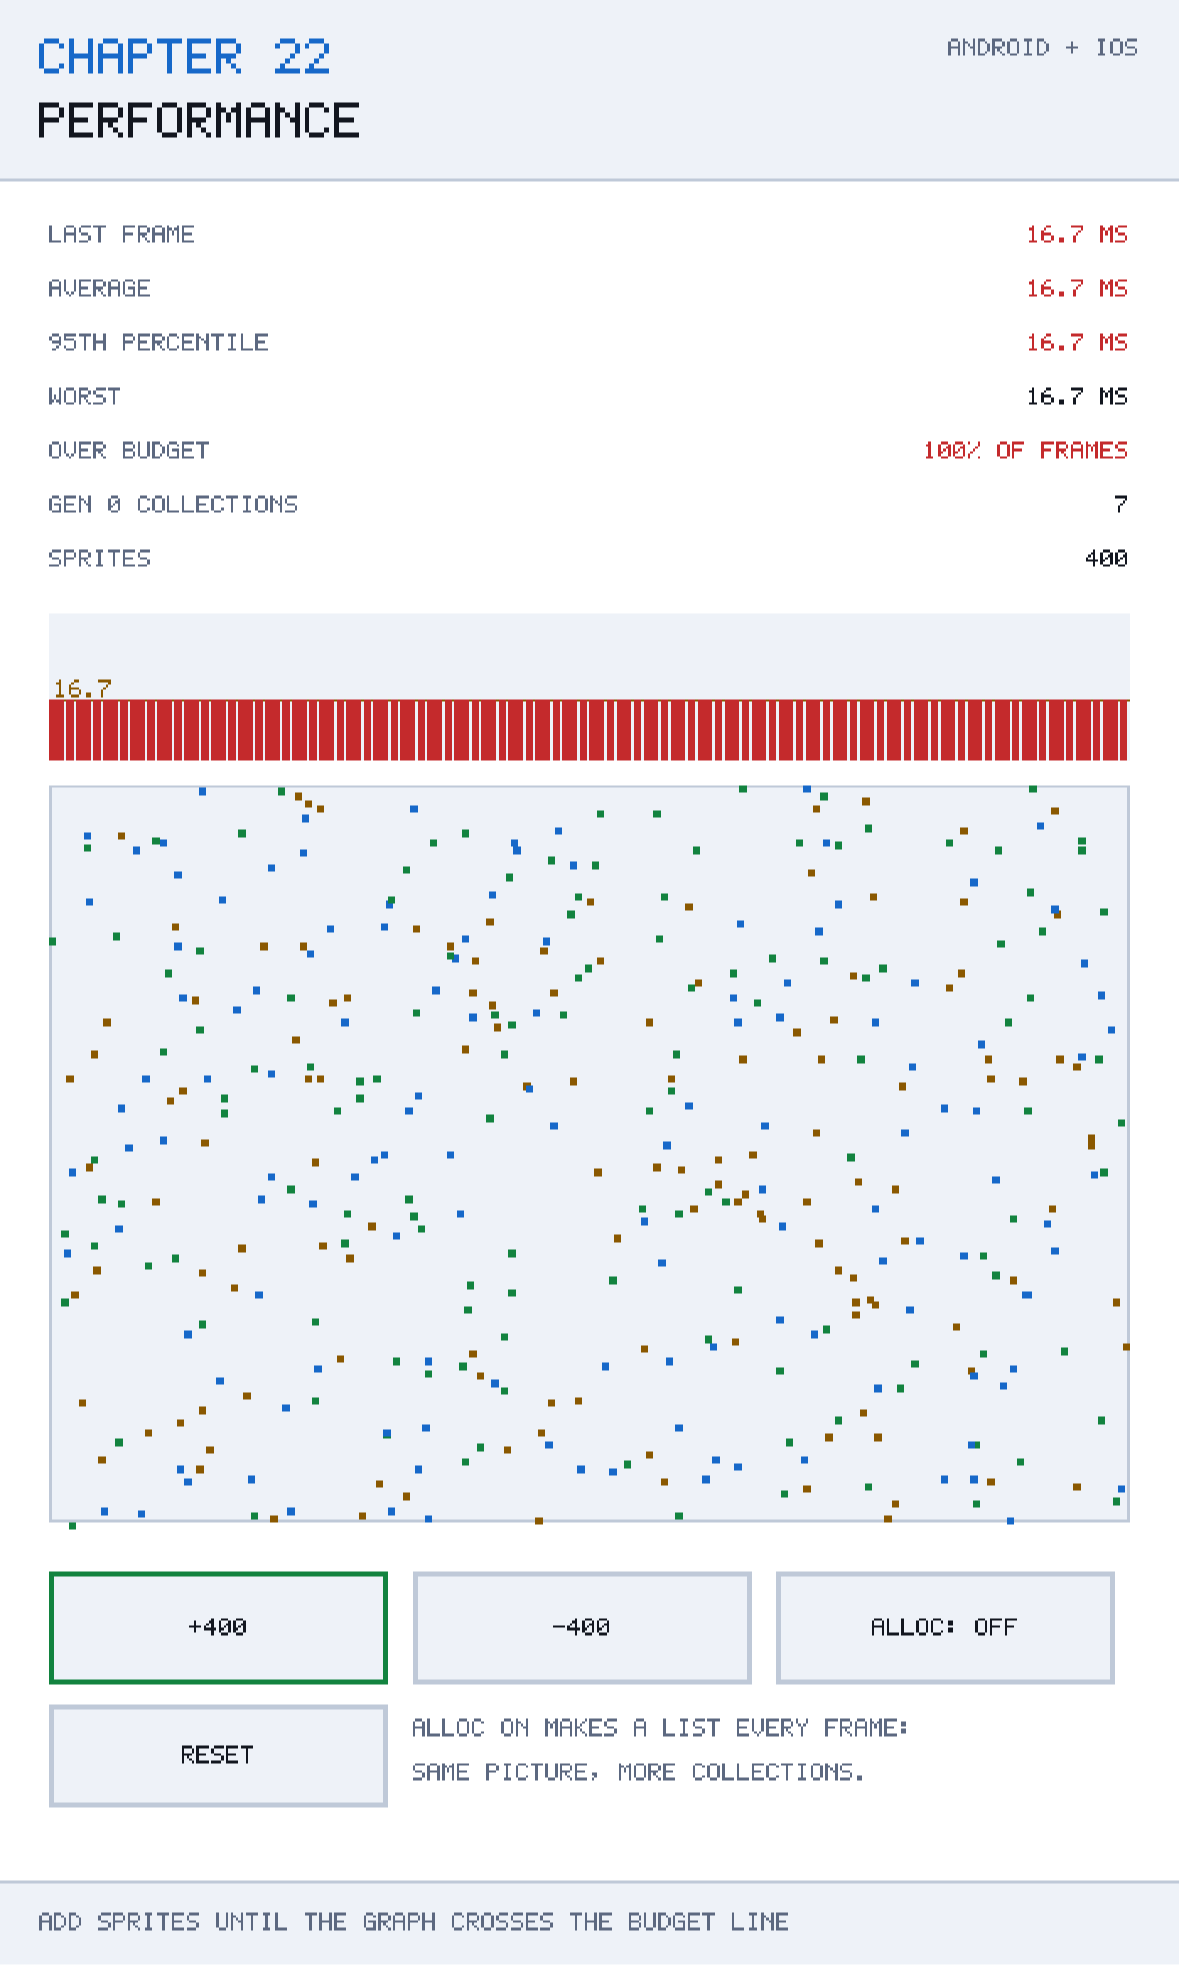
The demonstration is at github.com/nodoid/MonoGameBook/src/Chapter22. It draws a live frame graph with the 60 fps budget marked, and lets you add sprites until the graph crosses the line. A second control switches between an allocating and a non-allocating implementation of the same work, so you can watch the collection counter move.
The budget
At 60 frames a second you have 16.67 milliseconds per frame for everything: input, update, draw, and whatever the platform does on your behalf. At 30 fps it is 33.3 ms. On a 120 Hz display running at full rate it is 8.3 ms.
A useful way to hold that number is to know what fits in it. On a mid-range phone, very roughly:
| Work | Typical cost |
|---|---|
A SpriteBatch draw call | 0.05–0.2 ms |
| 500 sprites in one batch | 1–3 ms |
| A gen-0 garbage collection | 0.3–2 ms |
| A gen-2 garbage collection | 10–80 ms |
| Chapter 19's solver, 200 steps | 1–4 ms |
| Chapter 17's generator, whole puzzle | 30–1200 ms |
Two things stand out. A gen-2 collection can eat several frames on its own, which is why the allocation half of this chapter exists. And the generator is off the scale entirely, which is why Chapter 17 put it on a worker thread.
You do not get all 16.7 ms. The platform takes some, the driver takes some, and you want headroom so that a frame with an explosion in it still fits. Budgeting about 70% of the frame for your own work — roughly 11 ms at 60 fps — is a reasonable target.
A ring buffer of frame times
public sealed class FrameProfiler
{
    /// <summary>The frame budget at 60 frames a second, in milliseconds.</summary>
    public const double Budget60 = 1000.0 / 60.0;

    private readonly double[] samples;
    private int count;
    private int next;

    public FrameProfiler(int windowSize = 120) => samples = new double[windowSize];

    public void Add(double milliseconds)
    {
        LastMilliseconds = milliseconds;
        samples[next] = milliseconds;
        next = (next + 1) % samples.Length;

        if (count < samples.Length)
            count++;

        Collections = GC.CollectionCount(0) - baselineCollections;
    }
}
A fixed array, an index that wraps, and a count that stops growing once the buffer is full. This is the same fixed-capacity discipline as Chapter 14's particle pool, and for the same reason: a profiler that allocates is a profiler that changes what it is measuring.
A window of 120 frames is two seconds at 60 fps. That is a good default — long enough to catch a periodic spike, short enough that the numbers respond when you change something.
Reading the window back in order is the only fiddly part:
/// <summary>The sample at <paramref name="index"/>, oldest first, for drawing a graph.</summary>
public double SampleAt(int index) =>
    samples[(next - count + index + samples.Length * 2) % samples.Length];
next - count is where the oldest sample lives, which can be negative once the buffer has wrapped. Adding samples.Length * 2 before the modulo pushes it positive without changing the result — the standard trick for a wrap-around index in a language whose % can return a negative value. (C#'s can; Chapter 13 met the same thing in NameEntry.Previous.)
The numbers that matter
public double Average => count == 0 ? 0 : Window().Average();
public double Worst   => count == 0 ? 0 : Window().Max();
public double Best    => count == 0 ? 0 : Window().Min();

/// <summary>The frame time 95% of frames come in under.</summary>
public double Percentile95
{
    get
    {
        if (count == 0)
            return 0;

        double[] sorted = [.. Window().Order()];
        return sorted[Math.Min(sorted.Length - 1, (int)(sorted.Length * 0.95))];
    }
}

/// <summary>Fraction of the window that missed the 60fps budget.</summary>
public double MissedFraction =>
    count == 0 ? 0 : Window().Count(sample => sample > Budget60) / (double)count;
The class comment is the thesis:
The average is the least useful number here. A game that averages 14 ms and spikes to 40 ms twice a second feels broken, and only the worst-case figures say so.
Read the four together and each answers a different question.
Average tells you whether the steady state fits. If the average is already over budget, you have too much work per frame and no amount of spike-hunting will help.
95th percentile tells you what the game usually feels like. One frame in twenty is worse than this; nineteen in twenty are better. If the mean is 10 ms and the p95 is 11 ms, the game is smooth. If the mean is 10 and the p95 is 30, it is not, whatever the mean says.
Worst tells you the size of your biggest problem. A single 80 ms frame is one visible hitch, and if it happens when the player is hit, it is a hitch at the worst possible moment.
Missed fraction is the one to put in a bug report. "9% of frames missed the 60 fps budget" is a number a colleague can act on; "it feels janky" is not.
Percentiles, not averages, for anything a human perceives
This is not specific to games. Latency, load time, response time — the distribution's tail is what people notice, and the mean systematically hides it. If you take one habit from this chapter, take this one.
Counting collections
/// <summary>Garbage collections seen since the profiler started, which is the allocation smell.</summary>
public int Collections { get; private set; }

private int baselineCollections = GC.CollectionCount(0);
GC.CollectionCount(0) returns how many generation-0 collections have happened in the process. Subtract a baseline taken when the profiler started and you have collections-since-then. It is a single property read, costs nothing, and works on every platform .NET runs on.
This one number is the most efficient bug-finder in the chapter. A game that is not allocating per frame produces a collection count that stays put for minutes. A game that allocates a little every frame produces a count that climbs steadily — and every one of those collections is a small pause.
The workflow is: play for thirty seconds, look at the number. If it has moved, something in your frame is allocating, and the frame graph will show small regular spikes to match.
GC.GetTotalAllocatedBytes(precise: false) is the natural companion — it tells you how much rather than how often — and sampling it once a second gives you an allocation rate in bytes per frame, which is the number you actually want when hunting.
Where the allocations come from
The chapter's demonstration puts the point at its simplest:
/// <summary>Allocates a fresh list every call. Fine once; ruinous every frame.</summary>
public static List<int> Wasteful(int count)
{
    var list = new List<int>();
    for (int index = 0; index < count; index++)
        list.Add(index);

    return list;
}

/// <summary>Fills a buffer the caller already owns. Nothing new is allocated.</summary>
public static void Reused(int[] buffer, int count)
{
    for (int index = 0; index < count && index < buffer.Length; index++)
        buffer[index] = index;
}
Same output, same loop, and the difference is who owns the memory. Wasteful allocates a list and — because List<T> doubles its backing array as it grows — several arrays along the way. Called once at load, that is nothing. Called every frame, it is the collection counter climbing.
That pattern has a name worth internalising: let the caller own the buffer. It appears throughout this book. Chapter 14's particle array, Chapter 16's suggestion to reuse a bool[81] instead of allocating a HashSet, and this method are the same idea three times.
The usual culprits in a MonoGame game, in rough order of how often they catch people:
String concatenation and interpolation. $"SCORE {score}" allocates a string every frame. A HUD with six such labels allocates six strings per frame — 360 a second. Cache the string and rebuild it only when the value changes, which is usually a few times a minute rather than sixty times a second.
LINQ in the update path. entities.Where(e => e.IsAlive).ToList() allocates an iterator, a closure and a list. LINQ is excellent and belongs in loading code, editor tools and tests. In a per-frame path, write the loop.
Closures that capture. A lambda capturing a local allocates a display class. This is why RemoveAll(entity => !entity.IsAlive) in Chapter 7 is acceptable — the lambda captures nothing, so the compiler caches a single delegate instance — while RemoveAll(entity => entity.Id == someLocal) allocates every call.
Boxing. Passing a struct where an object or a non-generic interface is expected allocates. string.Format with an int, Dictionary<SoundId, ...> with a default comparer on an enum in older runtimes, and foreach over a non-generic collection are the usual routes in.
`params` arrays and `IEnumerable` returns. Any method returning IEnumerable<T> from an iterator allocates the state machine; any params call with arguments allocates an array.
`new` in `Draw`. A Rectangle is a struct and is free; a Color[], a List<Vector2> or a StringBuilder created inside a draw call is not.
Measuring properly
Three conditions have to hold before a measurement means anything, and all three are routinely violated.
Release build
A Debug build disables inlining, keeps locals alive for the debugger, and adds bounds-check and overflow behaviour a Release build optimises away. Numbers from a Debug build are typically 20–100% worse and — more misleadingly — worse in different places. Always profile -c Release.
On the device
Chapter 2's list applies with full force here. Your laptop has a fan, a desktop-class GPU, and gigabytes of memory bandwidth to spare. A phone has none of those, and its fill rate in particular is a fraction of a desktop's. A frame graph from a DesktopGL build tells you almost nothing about a phone.
After it has warmed up, and after it has got hot
The first few seconds of any run are dominated by JIT compilation, shader compilation and texture uploads. Discard them. Then keep playing: after five to ten minutes a phone reduces its clocks, and the frame graph you get then is the one your players will actually experience. A game that is comfortable for thirty seconds and misses 20% of frames after eight minutes is a game with a thermal problem, and only a long run will show it.
The demonstration prints Collections since the profiler was reset. If you want a fair comparison between two implementations, press reset, run each for the same length of time, and compare. Collection counts are cumulative and will otherwise flatter whichever you measured second.
A workflow
When the frame graph crosses the line, work in this order.
- Look at the shape. Regular small spikes suggest allocation. One large spike suggests a one-off — loading, a generation, a shader compile. A rising baseline suggests you are simply doing more work than you were, or the device is throttling.
- Check the collection counter. If it is climbing, fix that first; allocation problems are usually cheaper to fix than algorithmic ones and they cause the most visible artefact.
- Halve something. Draw half the sprites, or update half the entities, and see which half the cost was in. Bisection finds the expensive system faster than reading code does.
- Count draw calls. In MonoGame that means counting
SpriteBatch.Begincalls, because each pair is at least one draw call. Merging two batches is often a bigger win than optimising what is inside them. - Only then optimise code. And measure after each change, because roughly a third of "obvious" optimisations make things slower.
Caveats
Measuring costs something
The profiler itself runs every frame. The ring buffer write is free; Percentile95 sorts the window and Window() allocates an enumerator, so calling those every frame is exactly the sin the chapter is about. Compute the statistics once or twice a second for display, not once a frame.
GC.CollectionCount is a signal, not a diagnosis
It tells you collections happened. It does not tell you what allocated. For that you need a real profiler attached — dotnet-counters and dotnet-trace both work against a running mobile app — or a bisect. Use the counter to know there is a problem worth chasing.
Frame time is not the only budget
Memory and battery matter too, and a game that hits 60 fps by holding 400 MB of textures will be killed in the background and will drain a battery in an hour. Watch resident memory alongside frame time.
Do not optimise what you have not measured
The most common outcome of an unmeasured optimisation is code that is harder to read and exactly as fast. Every technique in this chapter is worth applying after the graph has told you where the time goes, and not before. Chapter 7's advice about entity-component systems is the same advice: complexity you did not measure a need for is complexity you pay for twice.
Building and running this chapter
The solution is src/Chapter22/Chapter22.sln in the book's repository at github.com/nodoid/MonoGameBook/src/Chapter22.
cd src/Chapter22
dotnet build -c Release Android/Chapter.Android.csproj
dotnet build -c Release iOS/Chapter.iOS.csproj
Note the -c Release. This is the one chapter where a Debug build will actively mislead you.
To deploy to a connected Android device or a running emulator:
dotnet build -c Release Android/Chapter.Android.csproj -t:RunTo run on the iOS Simulator:
dotnet build -c Release iOS/Chapter.iOS.csproj \
  -p:RuntimeIdentifier=iossimulator-arm64
xcrun simctl install booted \
  iOS/bin/Release/net10.0-ios/iossimulator-arm64/Chapter22.iOS.app
xcrun simctl launch booted com.monogamebook.chapter22
Remember that the simulator runs on your Mac's hardware. Use it to check the profiler works; use a real phone for any number you intend to believe.
Try it yourself
- Add sprites until the graph crosses the budget line, then note the average and the 95th percentile. The p95 crosses first.
- Switch to the allocating implementation and watch the collection counter climb and small regular spikes appear in the graph.
- Add
$"FRAME {profiler.LastMilliseconds:0.0}"to your draw code and watch the collection counter respond to one interpolated string per frame. - Run the same build on the simulator and on a real phone, with the same sprite count. Compare the worst frame.
- Leave a heavy scene running for ten minutes and watch the baseline rise. That is thermal throttling, and no code change will fix it.
Summary
The average frame time is the number everyone quotes and the one that hides the problem. Report the 95th percentile, the worst frame, and the fraction of frames that missed the budget — those are what a player experiences, and "9% of frames missed 60 fps" is something a colleague can act on.
The profiler is a ring buffer of frame times, fixed size, allocating nothing, because a profiler that allocates changes what it measures. A 120-sample window is two seconds at 60 fps: long enough to catch a periodic spike, short enough to respond to a change.
GC.CollectionCount(0) minus a baseline is the cheapest useful allocation signal there is. A count that stays still means you are not allocating per frame; a count that climbs means you are, and the frame graph will show matching regular spikes. The usual sources are string interpolation in the HUD, LINQ in the update path, capturing closures, boxing, and anything new inside Draw.
The fix, almost always, is to let the caller own the buffer — the same idea as Chapter 14's particle pool and Chapter 16's reusable conflict array.
And measure honestly: a Release build, on a real device, after it has warmed up and again after it has got hot. Anything else is a measurement of your laptop. Look at the shape of the graph before you look at the code, bisect rather than read, count draw calls before optimising what is inside them, and never optimise something you have not measured.
Chapter 23 leaves the running game behind and starts the last part of the book: getting the thing onto a store. It begins with Android, where the gap between a debug APK and a bundle Google Play will accept is wider than it looks.