Spectra from the infrared can yield a large amount of information regarding the symmetry and also the composition of the compound. Unfortunately, and like most analytical techniques, cannot be used by itself to say anything about the structure or the relative concentrations of the components and i.r. does not quite follow the Beer-Lambert law at higher absorbance readings.
Three i.r. experiments were carried out. The first was to find the spectrum of the agar. Any duplicate wavelengths can then be ignored on subsequent scans. The results beneath have the duplicate wavelengths deleted.
The second experiment was a scan of the ammonical agar containing the NI3 adduct. This was performed using sodium chloride flats. The reason for this was that these flats were available and early "guesstimates" showed that the N-I stretch should be around 900 cm-1 - just within the capabilities of the sodium chloride flats. Subsequent research showed that while there should be a stretch at around 900 cm-1, the figure (based on available evidence for NCl3 and NBr28) would suggest a number around 390 cm-1. A line was in fact found at about 383 cm-1, the exact frequency depending on the molecular environment.
8 Huber, K.P., Herzberg, G. Molecular Spectra and Molecular Structure : Vol IV - Constants of diatomic molecules. p. 448. Van Nostrand Reinhold Company, NY. 1979
Below 800 cm-1, potassium bromide flats were used.
The designation of significant bands are given below the scans.
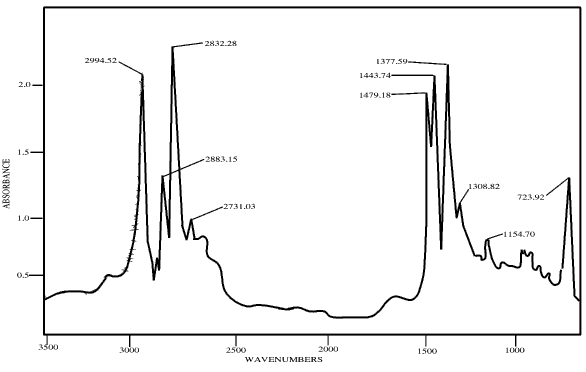
Scan 1 - NI3 - Agar, NaCl flats.
The most important peaks here are those between (and inclusive of) 2994 & 2832 cm-1. These are normally associated with the nitrogen containing groups (ammonium, NH4+, =NH- as well as nitrogen attached alkanes). No water peaks were found in either the "free OH" bands (around 3500 cm-1) or the associated bands (around 3250 cm-1).
The absence of any significant peaks between 2500 cm-1 to 1500 cm-1 is to be expected as this is the region associated with the likes of aromatic peaks and evidence of carboxyl groups.
The lower regions also point to C-C skeletons as well as sulphur and nitrogen containing groups.
Any further evidence drawn from the scan would not be of much use, with the exception of a peak around 725cm-1. This is the start of the carbon-halide stretching frequencies (as well as for other NH groups)
Nitrogen compounds tend to be higher than carbon compounds when observed as stretching frequencies. It can be assumed then that nitrogen-halide compounds would be around the same place as carbon-halides. This holds true for N-F and C-F as well as N-Cl and C-Cl. Both are within 10cm-1 of each other. With the lower halides (Br - As), the stretching frequencies differ.
C-Br and C-I are about 620 to 500 cm-1, C-I being lower than C-Br. The analogous nitrogen compounds are around 430 to 300cm-1 at which point, calcium fluoride plates would be needed as the potassium bromide plates would start to interfere with the patterns.
The second scan goes from 700 to 300 cm-1.
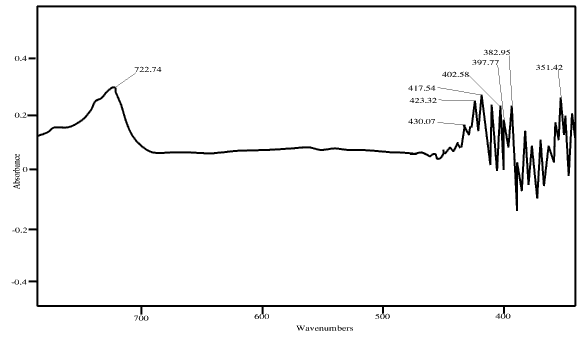
Scan 2.
Again, the "C-Cl" peak is observed at 723 cm-1. The results are therefore consistent with the previous scans in so much that the same peak is observed with KBr flats.
The theory of the C-Br and C-I is born out by having a blank region between 700 cm-1 and 450 cm-1. NBr and NI peaks are shown now at a lower frequency. The peak at 382 cm-1 is the most significant as it has been previously established that the NI peak is around 382 with an out of plane peak at 398 cm-1.1
Given the strong peaks and the agreement between this and already documented data, the peak assignments can be assumed to be what they are supposed to be i.e. those derived from NI3.
With this evidence, it is possible to say that the NI3 has been complexed in the agar matrix and thereby stabilised.
The stabilisation is such that it is possible to take a sample from the gel, grind and make into a mull with Nujol.
Pages
- Theory
- Safety
- Theory
- Bomb Calorimetry
- NI3 & Agar
- Analytical techniques
- Chemical Safety
- Practical methodology
- Sound as a detonator
- Determination of ammonia
- Main results
- Method 1 Results
- Ammonia results
- Minimum ammonia results
- Bomb calorimetry results
- Gel times
- IR Results
- XRD Results
- UV Results
- Conversion to HTML
- Bibliography
- Further work
- Acknowledgements
- Technology Used